


JProfiler 是一款Mac上实用的Java开发性能分析工具,可以帮助开发者分析Java应用的性能,解决线程、内存泄露的问题,支持的 IDE 包括:Eclipse, NetBeans, Intellij IDEA, JBuiler 以及 JDeveloper等,很不错!
软件介绍
JProfiler's intuitive UI helps you resolve performance bottlenecks,pin down memory leaks and understand threading issues.
When you profile, you need the most powerful tool you can get. At the same time, you do not want to spend time learning how to use the tool. JProfiler is just that: simple and powerful at the same time. Configuring sessions is straight-forward, third party integrations make getting started a breeze and profiling data is presented in a natural way. On all levels, JProfiler has been carefully designed to help you get started with solving your problems.
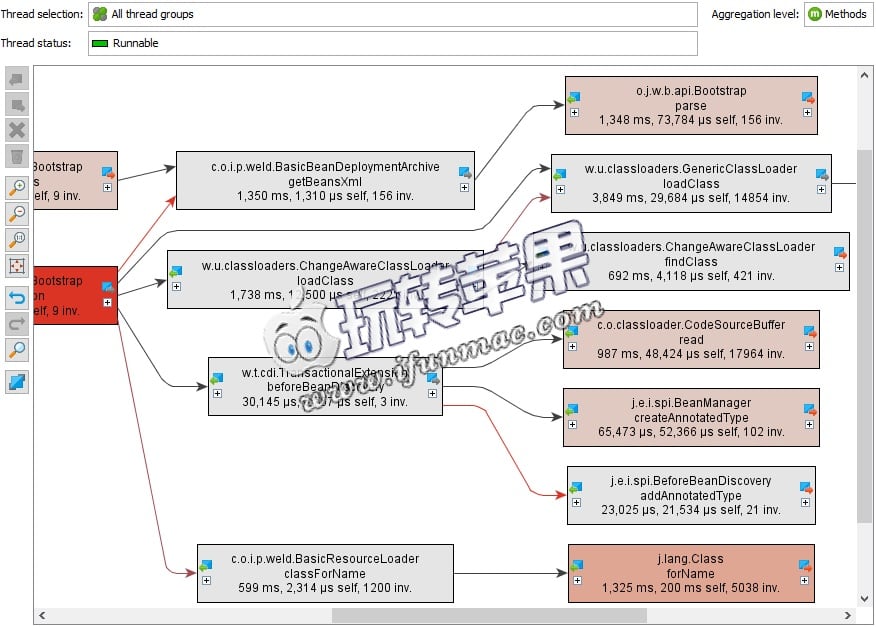
软件截图
软件安装方法
软件下载
仅限VIP用户下载,「立即通过赞助成为本站VIP」